

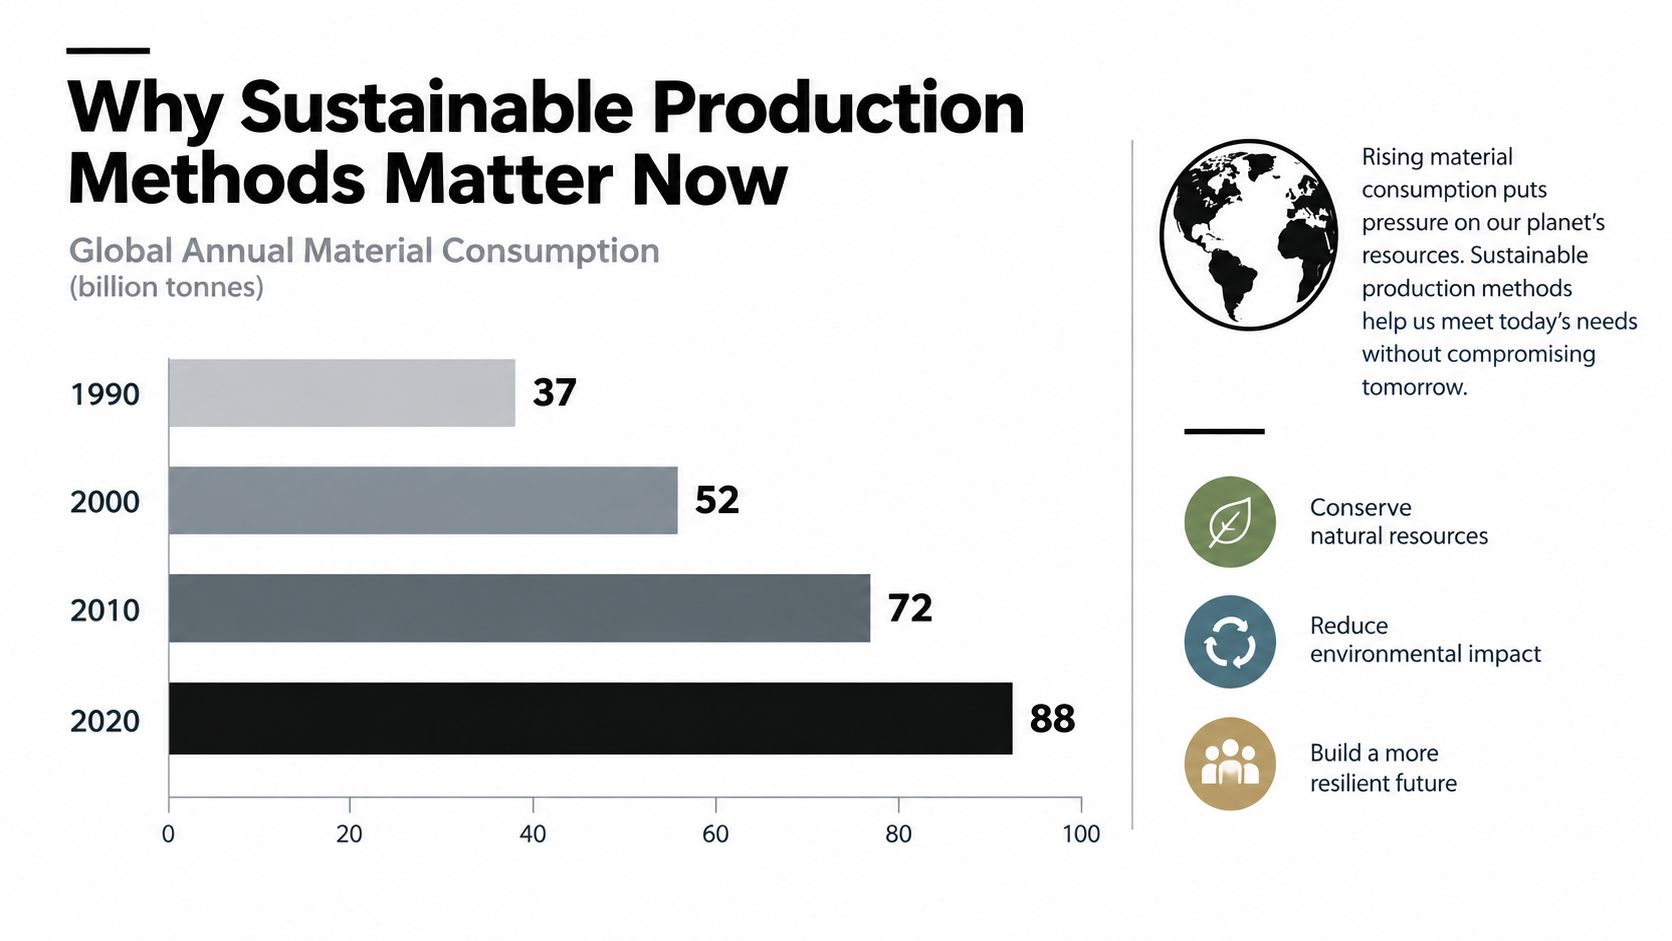
Global annual material consumption rose from approximately 37 billion tonnes in 1990 to 88 billion tonnes in 2017, and the OECD projects that extraction could double again by 2060 without stronger policy and technological intervention, according to its resource-efficiency and circularity report. That changes the question for any producer. Sustainable production isn't just about choosing a greener material or recycling more packaging. It's about delivering useful products with fewer inputs, less energy, less waste, and clearer evidence across the whole value chain.
Small businesses often know where waste appears, but they don't always measure it consistently. A supplier may provide material weights but not origin data. A utility bill may show total energy use without separating production from storage. A sustainability claim may sound reasonable while resting on an estimate that nobody has labeled as an estimate.
The practical answer is to treat sustainable production methods as a measurable operating system, not a marketing adjective. The sections below connect cleaner production, life-cycle thinking, circular design, operational strategies, credible KPIs, incomplete supply-chain data, sector examples, and a 90-day starting plan.
Why Sustainable Production Methods Matter Now
Average daily material use per person rose from 22 kilograms to 33 kilograms between 1990 and 2017, according to the OECD's analysis of resource efficiency and circular economies. That shift puts pressure on every stage of production, from raw-material extraction to disposal.
The issue extends beyond factories. Infrastructure, consumer goods, packaging, transport, and regional supply chains all require inputs. Improving efficiency can lower the material used per product, but total resource use may still rise if production and purchasing continue to grow.
For a small producer, the first practical question is not whether the business can measure everything. It is which inputs create the greatest waste, cost, or environmental burden, and which records can support a credible improvement claim.
A working definition
Sustainable production means designing and managing products to use fewer virgin materials, less energy, and less water, while producing less waste across sourcing, manufacturing, distribution, use, and end-of-life management. Terms such as “natural,” “green,” and “eco-friendly” describe an impression, not a measurable result.
A useful claim identifies four points:
- What changed: material use, energy use, water withdrawals, waste, or emissions.
- Where it changed: sourcing, production, packaging, delivery, use, or disposal.
- Compared with what: an earlier process, a conventional product, or an estimate.
- How certain is it: direct business records, supplier data, or an assumption.
Practical rule: Name the input, the unit of output, the comparison point, and the system boundary before publishing the claim.
Start with the records already available. A utility bill, batch sheet, purchase invoice, waste collection receipt, or packaging specification can establish a baseline. Label estimates clearly, then improve data quality where the decision or claim depends on it.
The strongest sustainable production methods connect operational control with product design. They reduce avoidable losses, keep materials useful longer, and prevent burdens from shifting to another stage. They can also reduce exposure to volatile material costs and supply interruptions, provided the business measures the result rather than assuming it.
The Core Principles Behind Sustainable Production Methods
A commercial kitchen shows how sustainability works in practice. An operator can track ingredients purchased, portions served, cleaning water, refrigeration energy, and scraps sent for disposal. A compostable container does not solve high preparation losses, especially if it uses more material or requires more transport energy than the previous option.
The same test applies to manufacturing, food production, packaging, and retail. Sustainable production methods connect operational control with product decisions, then use evidence to show whether an improvement is real.
Cleaner production removes avoidable losses
Cleaner production begins inside the operation. Review excessive energy use, unnecessary water consumption, material offcuts, defective products, rework, spills, and idle equipment. These losses often offer a better starting point than a visible but low-impact product change.
A small producer may find that inconsistent settings between shifts cause frequent rejects. Standardizing those settings can reduce wasted inputs without purchasing a new machine. Other practical actions include removing unnecessary processing steps, improving inefficient equipment, recovering waste heat, and recording material yield for each batch.
The useful question is “How much input becomes saleable output, and what happens to the rest?” Answer it with batch records, utility data, and waste receipts where possible. If some figures are estimated, label them rather than presenting assumptions as measured results.
Life-cycle assessment checks the whole journey
An improvement at the factory can create a burden elsewhere. Replacing plastic packaging with a heavier material may reduce fossil-resource use while increasing transport emissions because each shipment weighs more. A reusable container may also require cleaning energy and return logistics.
Life-cycle assessment, or LCA, examines raw-material extraction, manufacturing, distribution, use, and end-of-life. It gives producers a structured way to compare alternatives using the same system boundaries. For a small business, a full study may be beyond reach, but the method still helps identify missing information and avoid claims based on one favorable metric.
Circular design keeps value in use
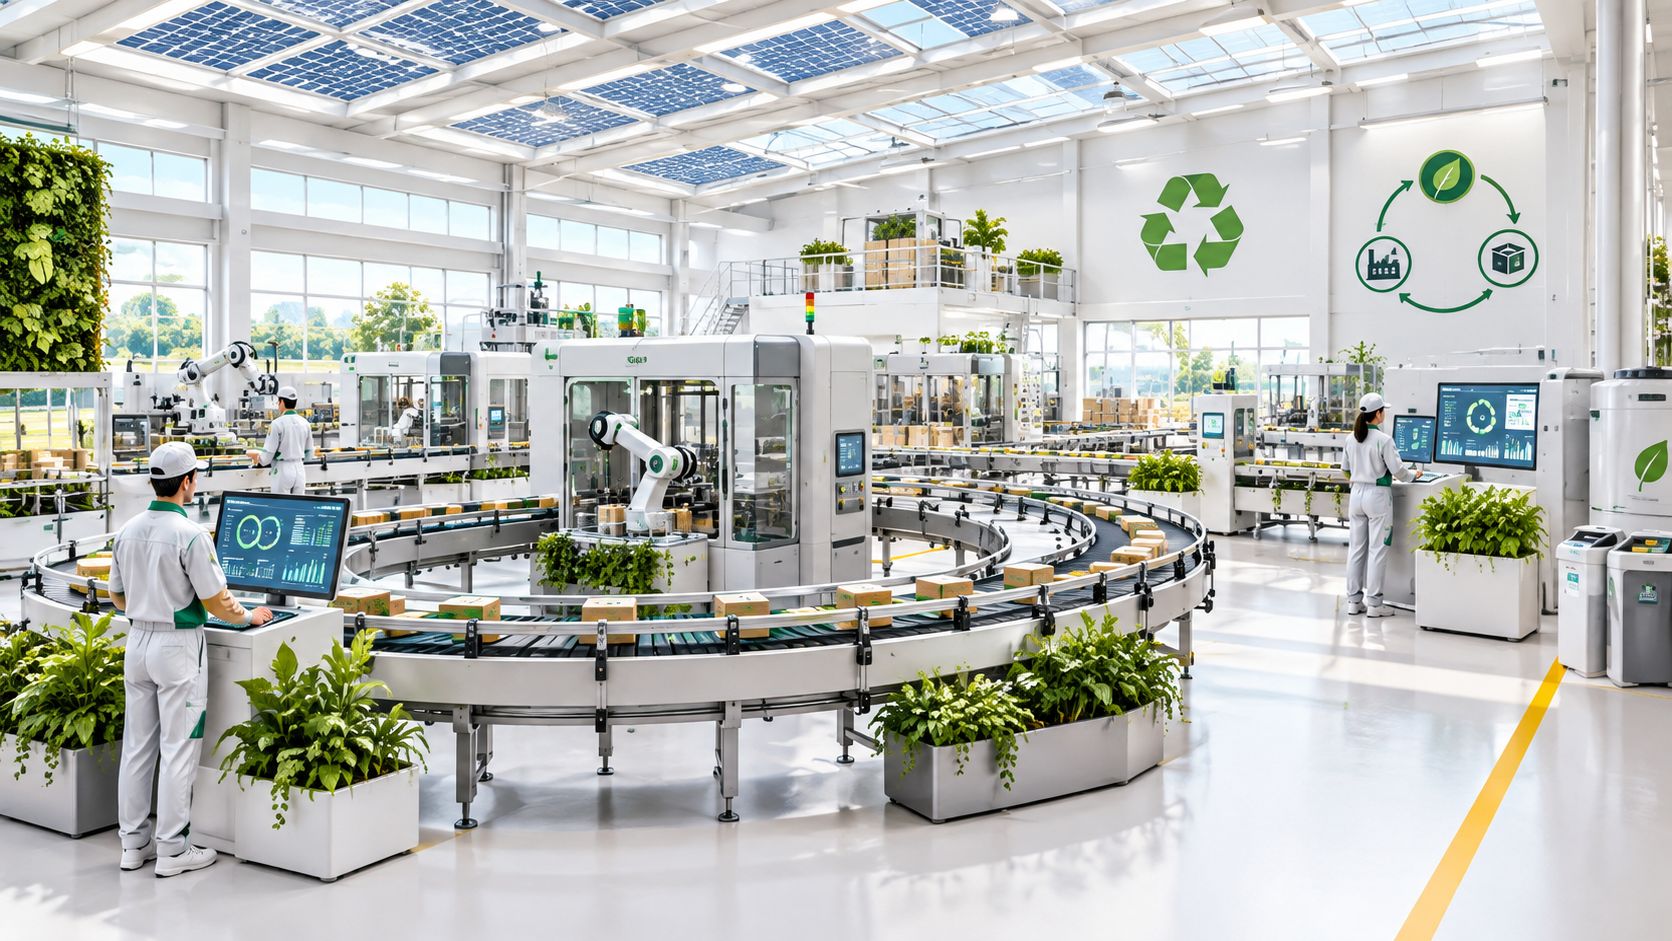
Circular design asks what happens after a sale. Can the product be repaired, refilled, reused, remanufactured, or disassembled? Can its materials stay useful instead of becoming waste after one short use?
The UNDP explanation of the circular economy describes keeping products and materials in productive use for as long as possible. In practice, prevention and durability come before disposal. Recycling has a role, but it does not compensate for short product life, difficult repair, or excessive material demand.
For packaging, ask one practical question: Can it enter a realistic recovery system rather than merely carrying a recycling symbol?
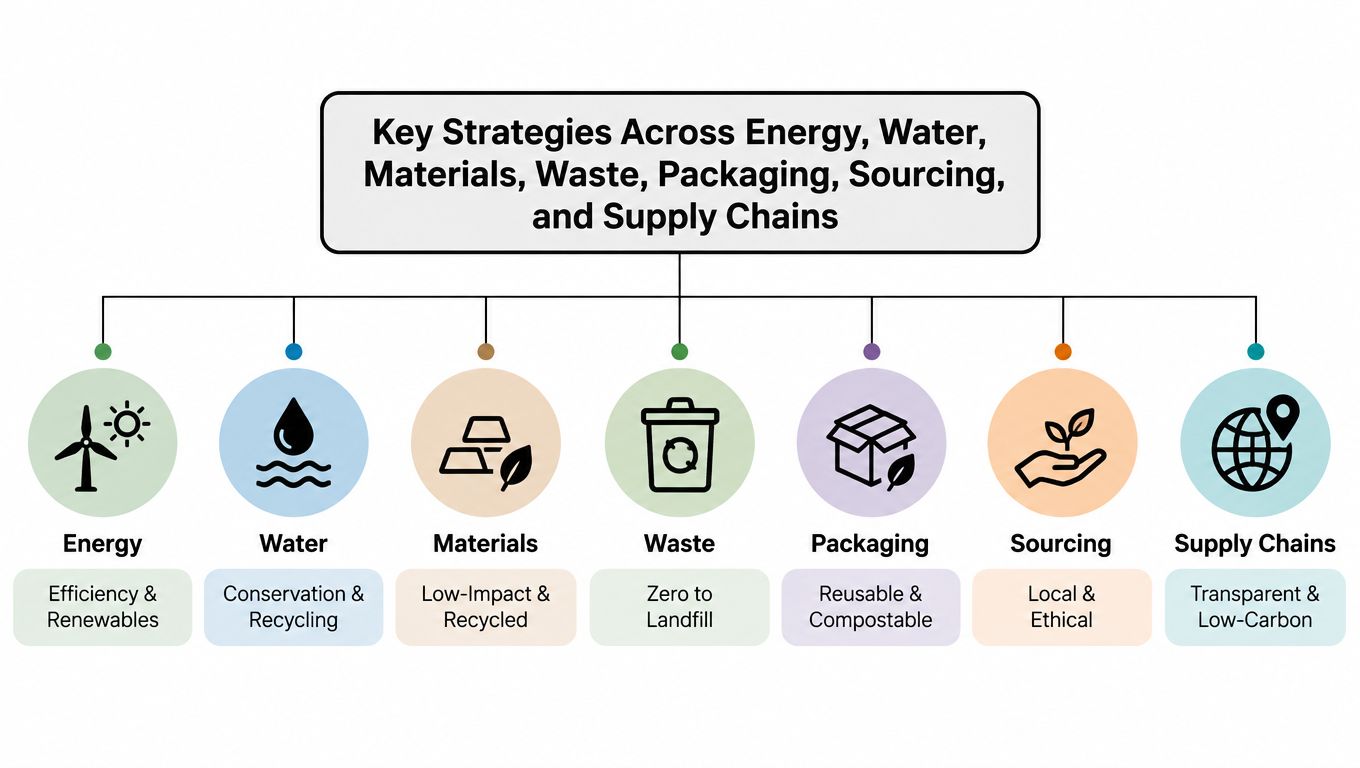
Key Strategies Across Energy, Water, Materials, Waste, Packaging, Sourcing, and Supply Chains
Sustainable production becomes manageable when broad principles guide specific operating decisions. A small producer does not need perfect data for every category. Start with the activities that create the highest costs, material losses, or environmental burdens. Record a consistent measure, then use the results to set the next priority.
Energy and water
Review equipment runtime, heating, cooling, compressed air, and refrigeration. Efficiency upgrades, waste-heat recovery, process controls, and renewable electricity procurement can reduce impacts, but the first audit question is simpler: which equipment uses energy, and during which activities?
For water, check leaks, unnecessary rinsing, once-through cooling, and cleaning cycles that exceed product or safety requirements. Closed-loop recovery and precision dosing can reduce withdrawals where quality and hygiene controls allow them.
Watch: energy and water per unit of saleable output. This denominator helps separate real efficiency gains from changes caused only by producing less.
Materials and waste
Material yield measures how much purchased input becomes saleable product. Improve cutting patterns, batch planning, storage conditions, and quality control before treating recycling as the main solution.
A useful waste audit records the material, its source, quantity, and destination. Separate streams at the point of disposal so recoverable materials remain usable. Organic residuals can also have productive uses where local systems can accept them.
Only 7.2% of materials used by the global economy were cycled back into production in 2023, down from 8.6% in 2020 and 9.1% in 2018, according to the circular-economy overview. The figures show why recycling alone is not a production strategy. Prevention, durability, repair, reuse, and remanufacturing reduce demand before material reaches the waste stream.
Packaging and sourcing
Assess packaging by material quantity, product protection, reuse potential, recyclability, and the collection systems available to customers. Lightweight packaging can create greater losses if it damages products. Refillable and reusable formats require a practical return process, not only a sustainability label.
Compare suppliers on material composition, traceability, labor expectations, delivery distance, and data quality. Local sourcing can shorten transport or strengthen working relationships, but location alone does not prove a lower life-cycle impact.
For biological inputs, verify handling, consistency, and documentation. Businesses selling mushroom-related products should evaluate the origin and storage requirements of mushroom liquid culture as part of input control.
Supply chains
Ask suppliers for standardized units, product composition, origin, packaging weight, and relevant environmental records. Consolidated deliveries and suitable transport modes can reduce logistics impacts, while route and load records provide the evidence behind those claims.
A credible supply-chain program separates measured facts from supplier information and estimates. Record what the business knows directly, request missing data in a consistent format, and label assumptions clearly. This creates a defensible starting point without requiring every upstream impact to be measured at once.
Metrics and KPIs That Turn Claims Into Evidence
A sustainability claim becomes useful when it has a denominator. “We reduced waste” is incomplete if production also fell. “We use less water” needs a comparison such as output, batch size, or another functional unit.
Start with a short list of measurements. Track output per unit of land, water, energy, fertilizer, and substrate. For climate reporting, record greenhouse-gas intensity per unit of saleable mass or production value. The OECD framework for measuring agricultural environmental performance defines nitrogen- and phosphorus-use efficiency as nutrient output divided by nutrient input.
The ratio is simple to interpret. Applying more nutrient while selling the same output lowers efficiency. Maintaining output while reducing unnecessary application raises it. No major technology project is required at first. Reliable input and output records matter more.
FAO reports that agriculture accounts for about 70% of global freshwater withdrawals and roughly 24% of anthropogenic greenhouse-gas emissions, while food loss and waste contributes about 8% of global greenhouse-gas emissions. These figures support practical priorities: measure water use, prevent spoilage, and control inputs. They do not prove that every intervention has the same benefit for every producer.
Core sustainability KPIs for small producers
| KPI | What it measures | How to express it |
|---|---|---|
| Energy intensity | Energy needed for saleable output | kWh per product unit |
| Water intensity | Water withdrawn or consumed | Liters per product unit |
| Material yield | Share of input becoming saleable output | Saleable kilograms divided by input kilograms |
| Waste intensity | Waste generated during production | Kilograms of waste per product unit |
| Nutrient-use efficiency | Nutrient output relative to nutrient input | Nitrogen or phosphorus output divided by input |
| Loss rate | Product lost through spoilage, damage, or rejects | Lost kilograms divided by total production |
| Emissions intensity | Climate impact relative to useful output | Kilograms of CO2-equivalent per product unit |
Build a simple control loop
Measure inputs first, then quantify output and losses. Identify the stage with the highest intensity, test one targeted intervention, and review the same KPI afterward. Possible actions include precision irrigation, closed-loop water recovery, better storage, renewable electricity, or converting organic residuals into usable soil amendments.
For dried goods, preservation and packaging losses can change the result. Guidance on freezing dried mushrooms can prompt better questions about product life and avoidable spoilage, but the producer's own records must support any operational claim. A small, consistent dataset is more credible than a long KPI list built on guesses.
The Measurement Gap and How to Handle Missing Supply Chain Data
Many small producers don't lack commitment. They lack comparable data. A supplier may send a spreadsheet in one unit, a certificate in another format, and a product description with no information about upstream materials. Historical records may sit in separate systems, while tier-two suppliers remain out of reach.
Recent manufacturing research identifies inadequate data quality as the most frequently cited data barrier, with poor granularity, incompatible formats, historical data silos, and limited access to upstream information among the documented problems in this research on digital technologies and circular manufacturing.
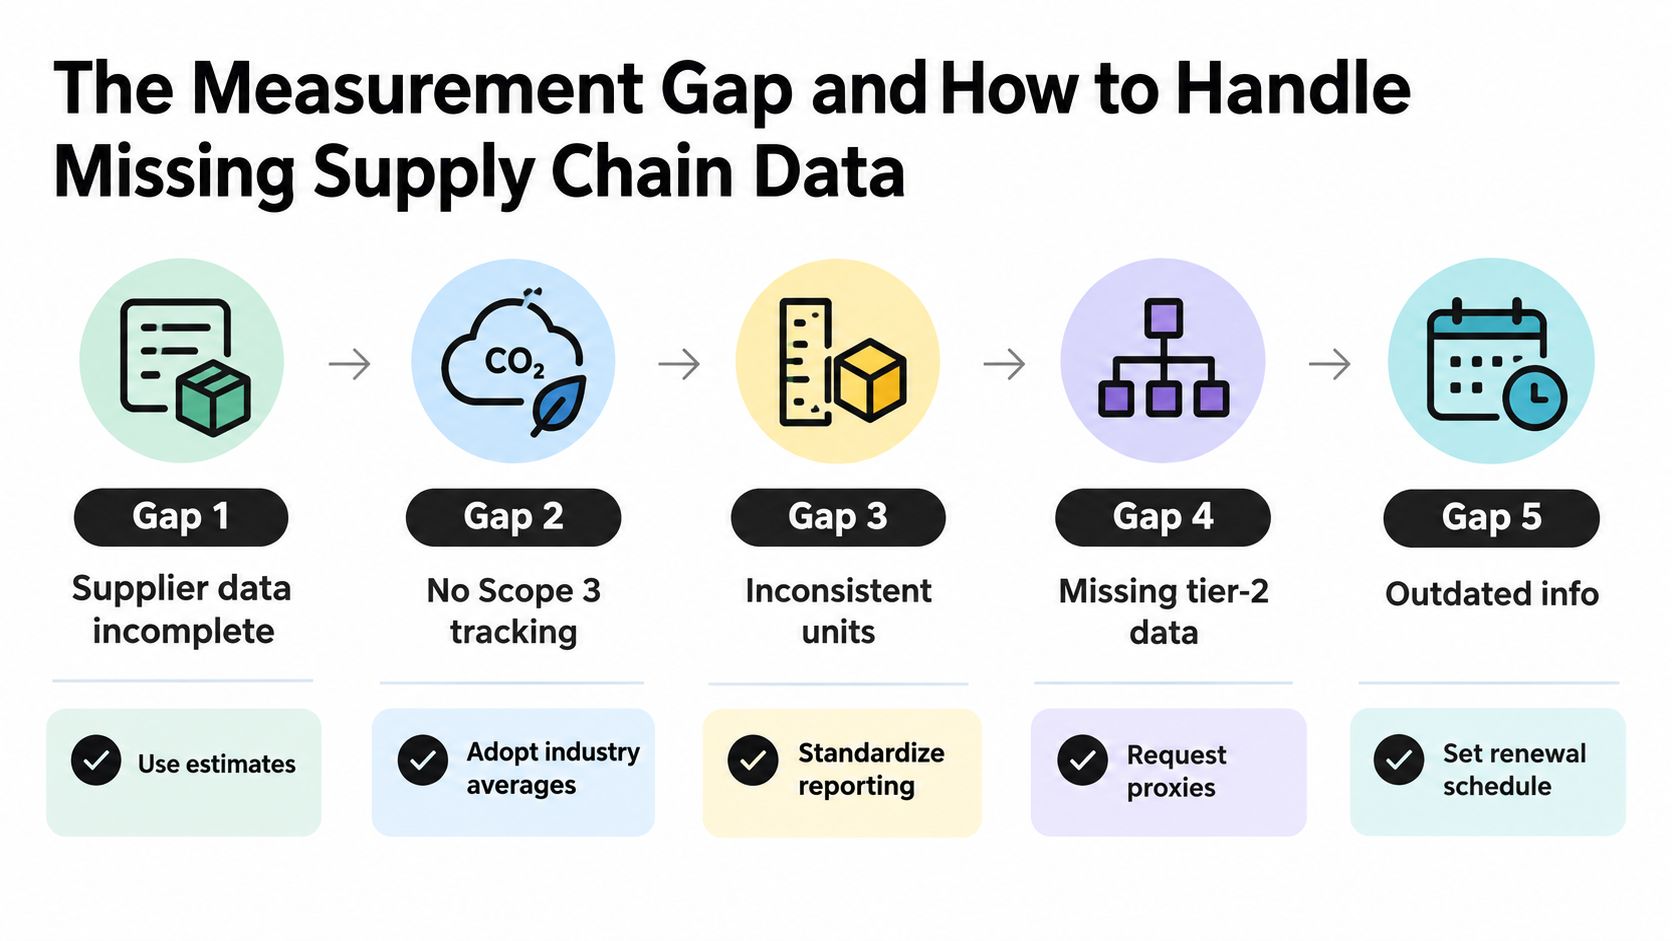
The mistake is to fill every gap with a confident-looking number. A defensible system separates measured results, supplier-provided information, and estimates. It also states the system boundary, such as factory-only, product delivery, or full life cycle.
Use a tiered evidence model
- Direct measurements: Start with utility bills, meter readings, purchased material weights, production quantities, rejected units, packaging weights, and waste-hauler records.
- Supplier information: Request composition, origin, energy information, transport details, and packaging data using consistent units. Keep the date and method attached to each record.
- Proxies and estimates: When direct data isn't available, use an accepted proxy or industry estimate, label it plainly, and explain what could change the result.
- Full LCA: Commission a life-cycle assessment when product comparisons, customer requirements, regulation, or a major design decision justify the cost and complexity.
Digitization helps only after definitions and measurement routines are stable. A dashboard cannot repair missing inputs, inconsistent units, or unclear boundaries. Start with a shared data sheet and a named owner for each KPI, then automate repetitive collection once the process produces trustworthy records.
A transparent estimate is more credible than an unsupported precise claim.
Sector Examples for Small Food Producers and Local Wellness Retailers
A small specialty food producer might begin with the same question used in a basic cost review: where are materials and money leaving the business without creating saleable value? The owner may find that energy use concentrates in refrigeration and heating, while waste comes from damaged ingredients, rejected batches, and packaging trim.
The business can create a quarterly scorecard with energy, water, material yield, waste, packaging, sourcing, and supplier-data quality. It might prioritize process controls and storage before redesigning packaging, because the first changes address visible losses. Once the records are stable, the owner can compare refillable, recyclable, or lighter formats without guessing which option performs better across transport and end-of-life.
A neighborhood wellness retailer
A local retail and delivery operation faces a different set of decisions. Product protection, cold-chain requirements, delivery routing, packaging, supplier reliability, and customer communication all shape its footprint.
The operator might consolidate deliveries, reduce unnecessary packaging layers, check whether storage equipment runs efficiently, and ask suppliers for consistent product and packaging information. It can also separate product claims from operational claims. Saying “our delivery routes are reviewed to reduce unnecessary travel” is more defensible than calling the entire business carbon neutral without a complete assessment.
Product assortment creates another opportunity for careful measurement. A retailer offering items such as blue oyster mushrooms can track spoilage, packaging weight, storage losses, and saleable output by product category. That information supports decisions about ordering, preservation, and packaging without turning sustainability into a vague label.
Both examples follow the same discipline:
- Start with losses: Measure what gets discarded, damaged, spoiled, or overused.
- Prioritize costs and impacts together: A high utility bill or disposal fee may point to an environmental improvement opportunity.
- Compare alternatives across the life cycle: Don't assume a new material or format is better without checking its full journey.
- Communicate the evidence level: Tell customers what was measured, estimated, or not yet available.
Certifications, Regulations, and Your 90 Day Starter Roadmap
Formal certification can help when buyers require it, when a label has clear rules, or when the audit process improves internal controls. It can become expensive and distracting when a small producer pursues several labels before understanding its own material, energy, water, and waste flows.
| Framework or label | What it generally addresses | Small-producer priority |
|---|---|---|
| Environmental management standard | Structured environmental objectives, controls, and continual improvement | Consider when customers or contracts require formal management |
| Organic certification | Defined production and input requirements for eligible biological products | Pursue when the product and target market support the claim |
| Fair-trade certification | Social, sourcing, and trading requirements under the applicable scheme | Consider when supplier relationships and customer demand justify it |
| Supply-chain due diligence rules | Documentation and risk management across upstream partners | Monitor early, especially when selling into regulated markets |
| Internal verified KPI program | Measured energy, water, materials, waste, and output performance | Start immediately, regardless of certification plans |
A recognized standard doesn't replace measurement. Certification can verify a defined system, but it can't make an unsupported product claim accurate. Begin with the operating data, then choose external frameworks that match customer needs and business scale.
A practical 90-day sequence
Days 1 to 7, establish the baseline. Record energy, water, purchased materials, production output, packaging, waste, rejects, and spoilage. Define each unit and assign one person to maintain the records.
Days 8 to 30, choose two or three priorities. Select the largest avoidable losses or the clearest cost and impact opportunities. Examples include reducing rejects, improving refrigeration controls, lowering water use, preventing spoilage, or removing unnecessary packaging.
Days 31 to 60, test targeted changes. Change one process at a time where possible. Keep the same measurement boundary and record any quality, safety, labor, or transport effects.
Days 61 to 90, review and document. Compare the selected KPIs with the baseline, record what changed, and identify uncertainty. If a result is estimated, say so. If the result is mixed, report the trade-off rather than hiding it.
This sequence keeps sustainability work useful. You don't need a perfect data system before taking action, but you do need enough consistency to know whether the action helped.
Common Questions About Sustainable Production Methods
Are sustainable production methods realistic for a very small business?
Yes, if the program starts with avoidable losses rather than expensive technology. Track energy, water, material yield, waste, and saleable output first, then focus on the categories that combine high cost with high environmental impact.
How long does it take to see measurable results?
Some changes become visible as soon as the business compares inputs with output consistently. Larger changes need a longer review period, especially when production volume, seasonality, or product mix varies. Use intensity metrics rather than total consumption alone.
How can a business avoid greenwashing?
Describe the action, boundary, comparison, and evidence level. Separate direct measurements from supplier estimates, and don't turn a packaging improvement into a claim about the entire product's environmental performance.
Is certification worth pursuing?
It may be worthwhile when customers, contracts, or market access require it. If not, build a reliable internal KPI system first. A clear baseline often shows whether formal certification would solve a real business need.
Metro Mush applies a practical, product-focused approach to its Detroit and Ann Arbor dispensary and delivery service, with a curated selection of mushroom products for adult customers. Visit Metro Mush to explore the menu, review local ordering options, and connect your product choices with a more informed approach to quality, packaging, storage, and responsible consumption.